
Find what drove yesterday's orders
Go from yesterday's orders back to the ads that earned them, the visits before each order, and the pieces those ads were made of.

You will end with the ads that earned yesterday's revenue, ranked; the journey of any one order, visit by visit, with the credit each visit earned; and the hooks, angles and avatars inside the ads that did the work.
When to use it
Every morning, or the day after a launch, a change of budget or an unusual day of sales. It takes ten minutes. Any role can follow it, viewers included.
The route
Set the period to Yesterday
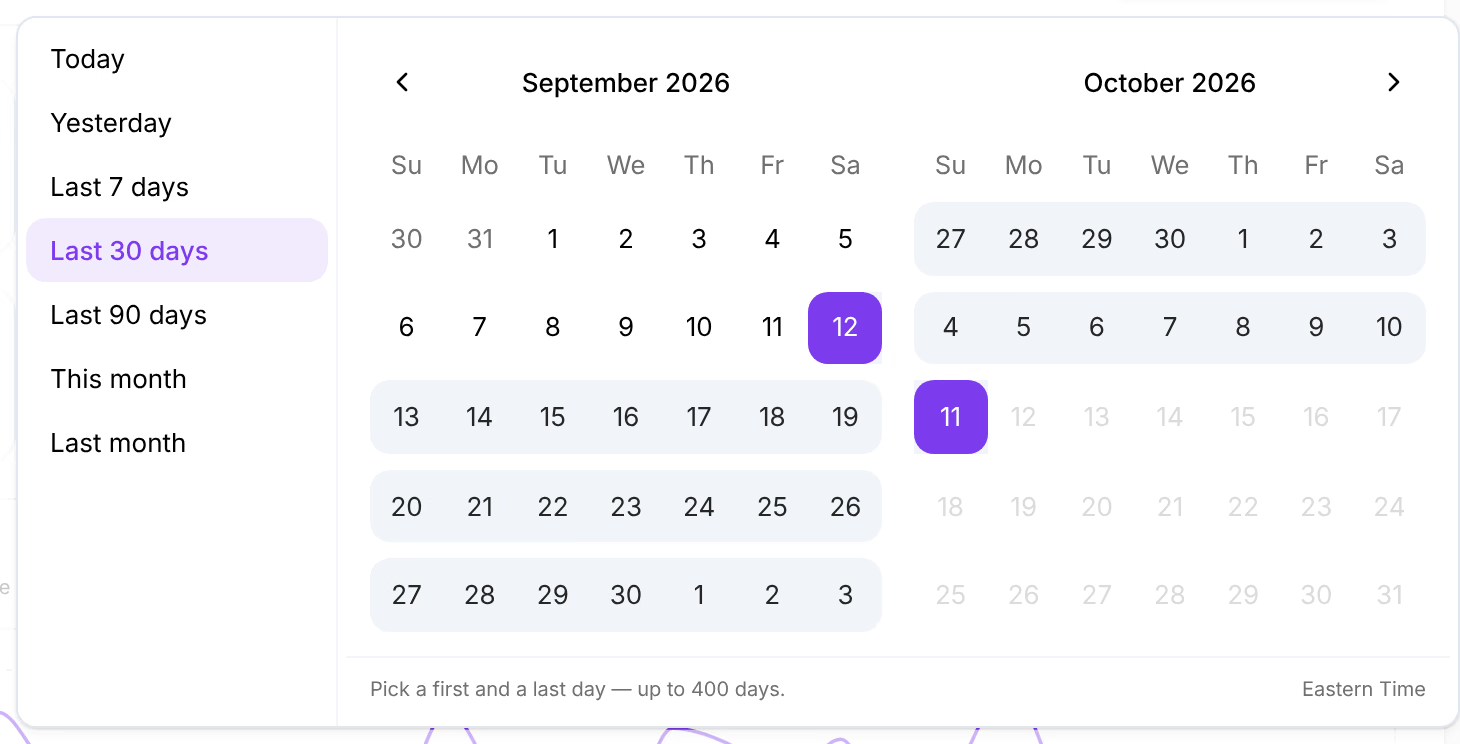
Open Analytics, then Campaigns. Press the period at the top right, Last 30 days to start with, and choose Yesterday. The period stays as you move between the Analytics screens.
Rank the ads
At the top right of Campaigns, choose Attribution, then Ads at the top left. Check Measurement health first: below a good pixel match rate, the figures under it leave orders out. Then read Performance: each ad with the orders and revenue Omnymous credits to it, beside what the platform claims.
Follow one order
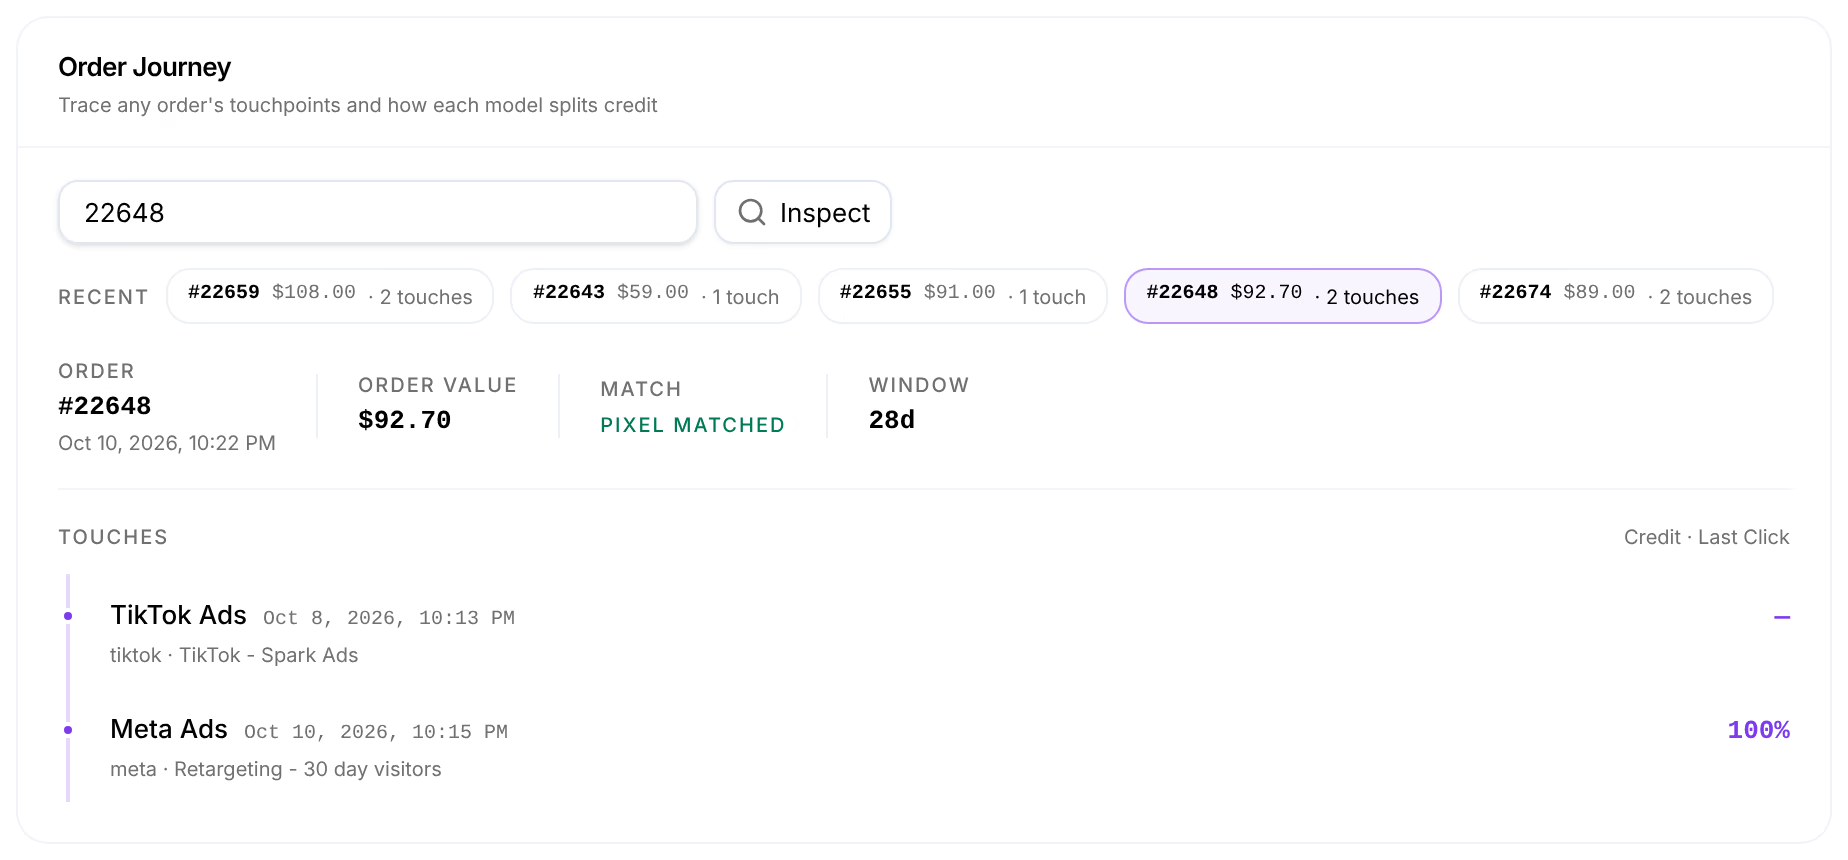
At the foot of the view, Order Journey takes a Shopify order number. Type one, or pick a recent order, and press Inspect. Each visit before the order is listed with its channel, its time, its campaign and the credit it earned.
Find the creatives
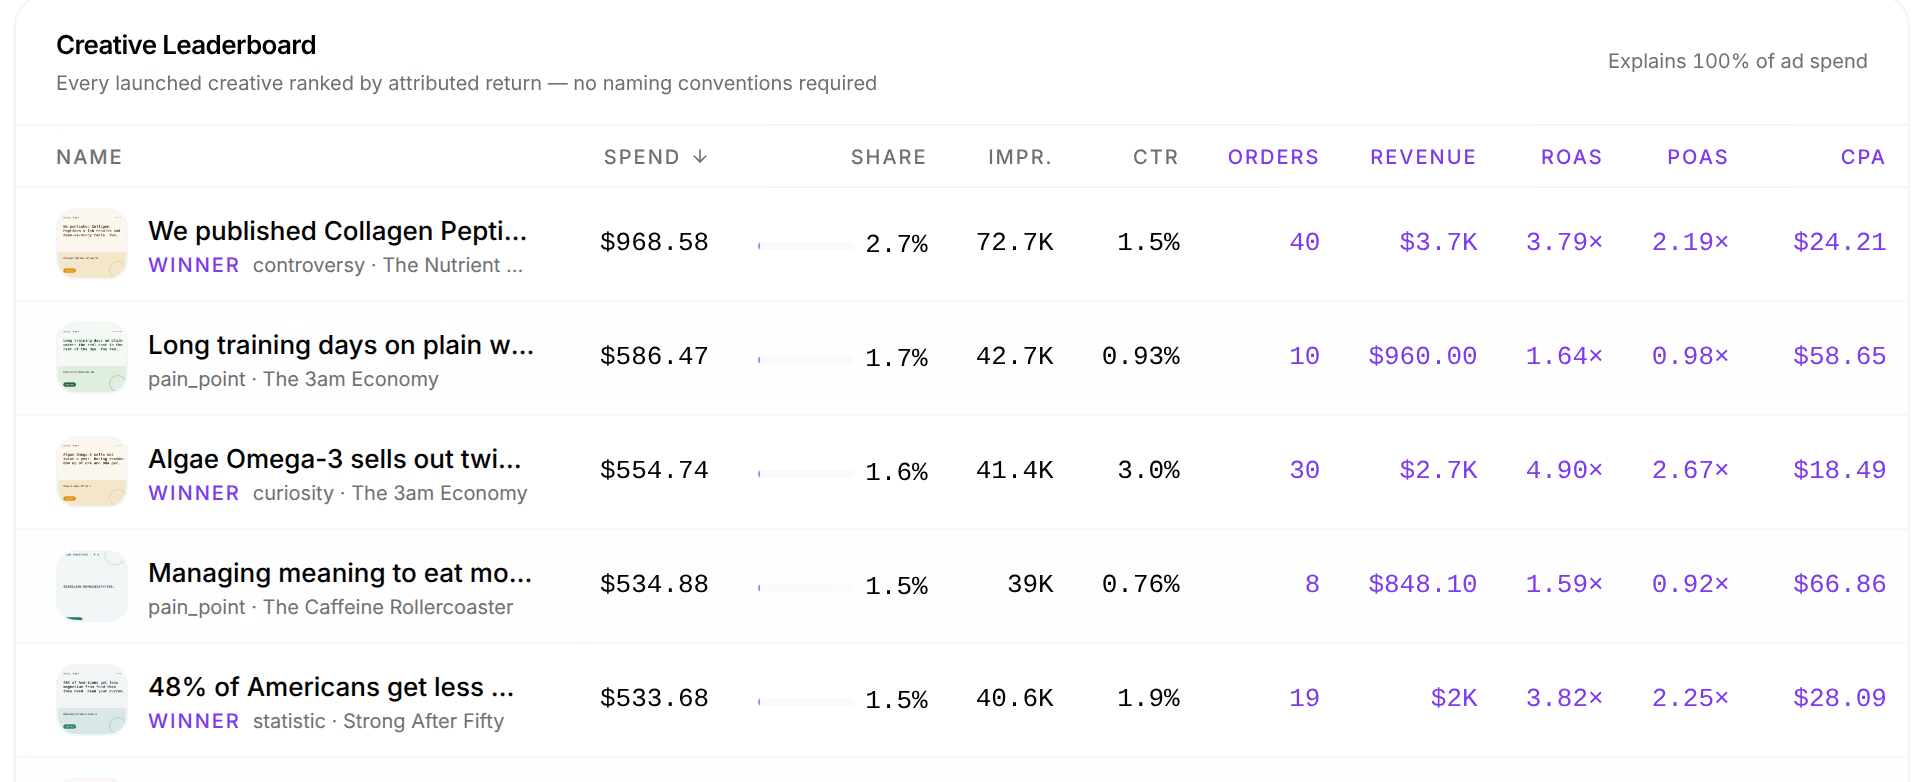
Open Creatives. The Creative Leaderboard ranks every creative that delivered yesterday by spend, with its hook type, its angle, and the orders, revenue and ROAS credited to it.
Open a creative's pieces
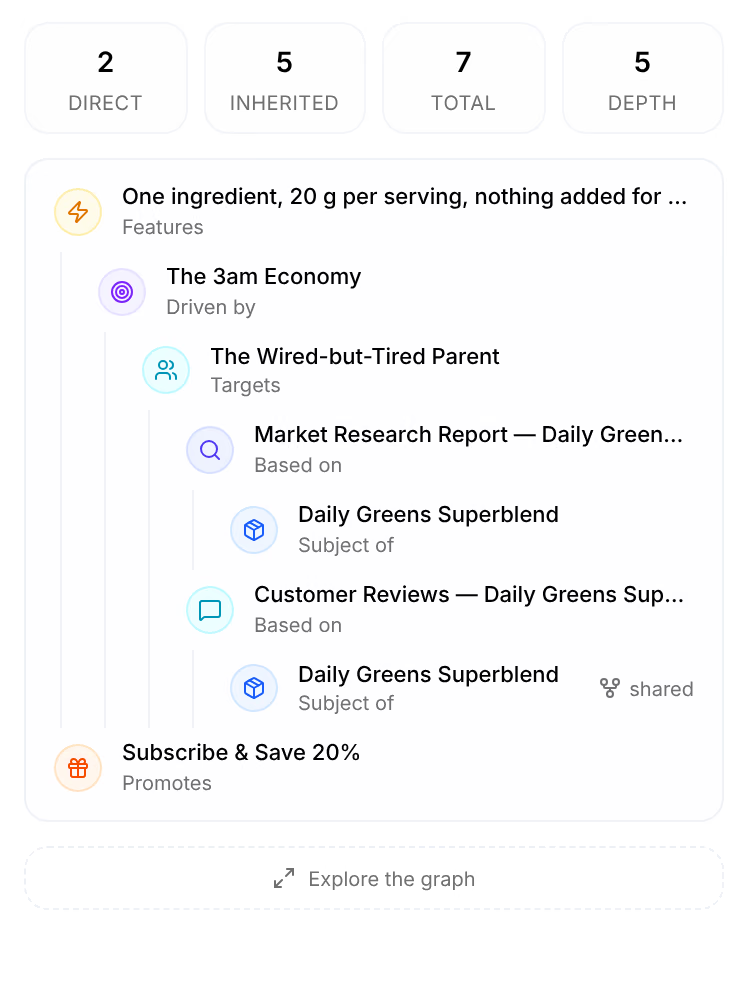
Find the creative in Library, under Assets, by its name, and open it. Its Composition shows what it was built from: its hook and offer, and the angle, avatar and research they carry.


Read the result
One day explains one day. An ad that earned yesterday may have been helped by an earlier one: the Order Journey shows every visit, and the attribution model at the top right decides how their credit is shared. Change it to Linear to see every visit's part.
To judge a piece rather than a day, open the Attribution Lab over 30 or 90 days: it calls a hook, an angle or an avatar a winner only when the evidence is there. See Attribution Lab.
Variations
- Ask instead. In Omni, ask "Show me the journey of order 22648": it lists every visit with its campaign, its creative and its landing page, under every attribution model. See How Omni answers.
- By page. Under Creatives, the Pages view follows yesterday's visits from the page they entered on to the order, and shows where they were lost.
- By channel. In Attribution, choose Channels to see how yesterday's revenue split between Meta, Google, TikTok, email and direct.
Related
- Check that the pixel is reportingConfirm the Omnymous pixel is sending your store's visits, see how many orders it ties to a visit, and trace one order back to the ads that brought it.
- CampaignsCampaigns sets what each ad platform claims beside what Omnymous credits, from the channel down to the single ad.
- CreativesCreatives shows what you produced, what is in market and which creatives win, then takes your creative apart in five more views.