
Dashboard
The Dashboard shows the last 30 days of your store in one screen: what you earned, what you spent, and how your creative did.

The Dashboard is the first screen after sign-in. Eight tiles give the period in numbers, and the chart under them shows spend and return day by day. It always shows the last 30 days and has no filters. To change the period or the attribution model, open one of the Analytics screens in the sidebar.
What you can do here
- Fill these tilesLaunch a first ad whose result comes back by hook, angle and avatar.
- Read a verdictWhat Identified, Confounded, Untested and Fatiguing mean.
The tiles
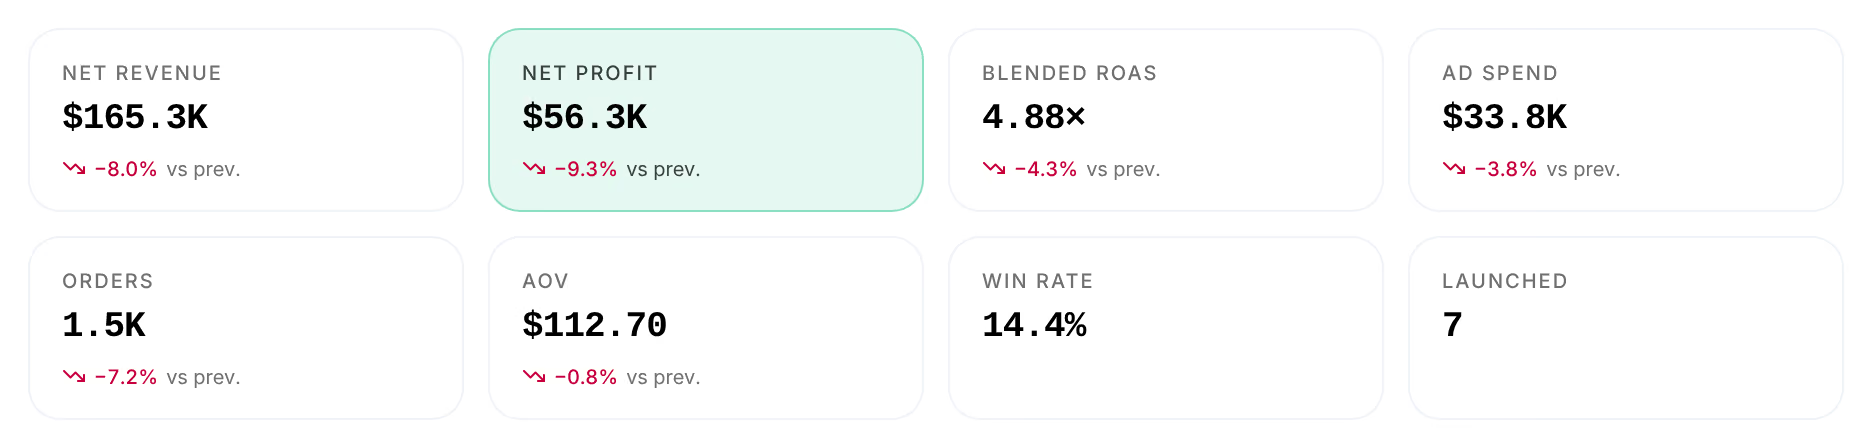
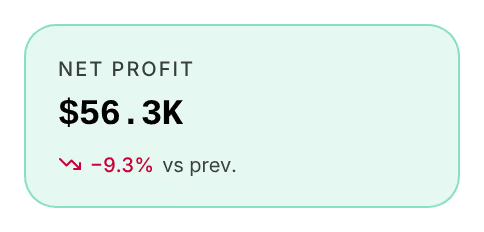
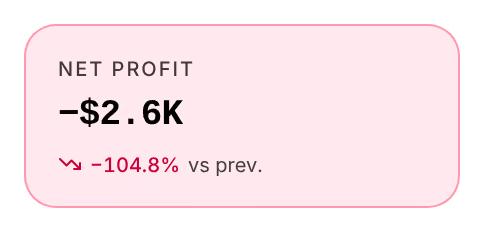
The first six tiles describe your store; Win Rate and Launched describe your creative. Net Profit is the one tile that is tinted: green in a period that made money, red in one that lost it.
Profit
Loss
Six tiles carry a change line, such as "−8.0% vs prev.". It compares the last 30 days with the 30 days before them.
| Name | What it does |
|---|---|
| Net Revenue | Gross sales, minus discounts, minus refunds. A refund counts on the day it was refunded. |
| Net Profit | What is left of net revenue after cost of goods, payment fees, shipping, variable costs, ad spend, fixed costs and AI spend. |
| Blended ROAS | Net revenue divided by total ad spend, across every connected platform. Also called MER. |
| Ad Spend | Spend on all connected platforms, converted to your store's currency at each day's rate. |
| Orders | Countable orders. Cancelled and unpaid orders are left out. |
| AOV | Average order value: net revenue divided by orders. |
| Win Rate | The share of creatives with spend that count as a winner. |
| Launched | Creatives that went live in the period. |
ROAS by day
One chart, two series, one point per day in your store's time zone. The shaded area is the day's ad spend. The violet line is blended ROAS: the day's net revenue divided by that spend. A day with no ad spend has no ROAS, so the line breaks there. It does not drop to zero.
Store analytics at the top right of the card opens the Store screen. If the chart reads "No ad spend in the last 30 days", no connected ad account spent in the period.
Creative pipeline
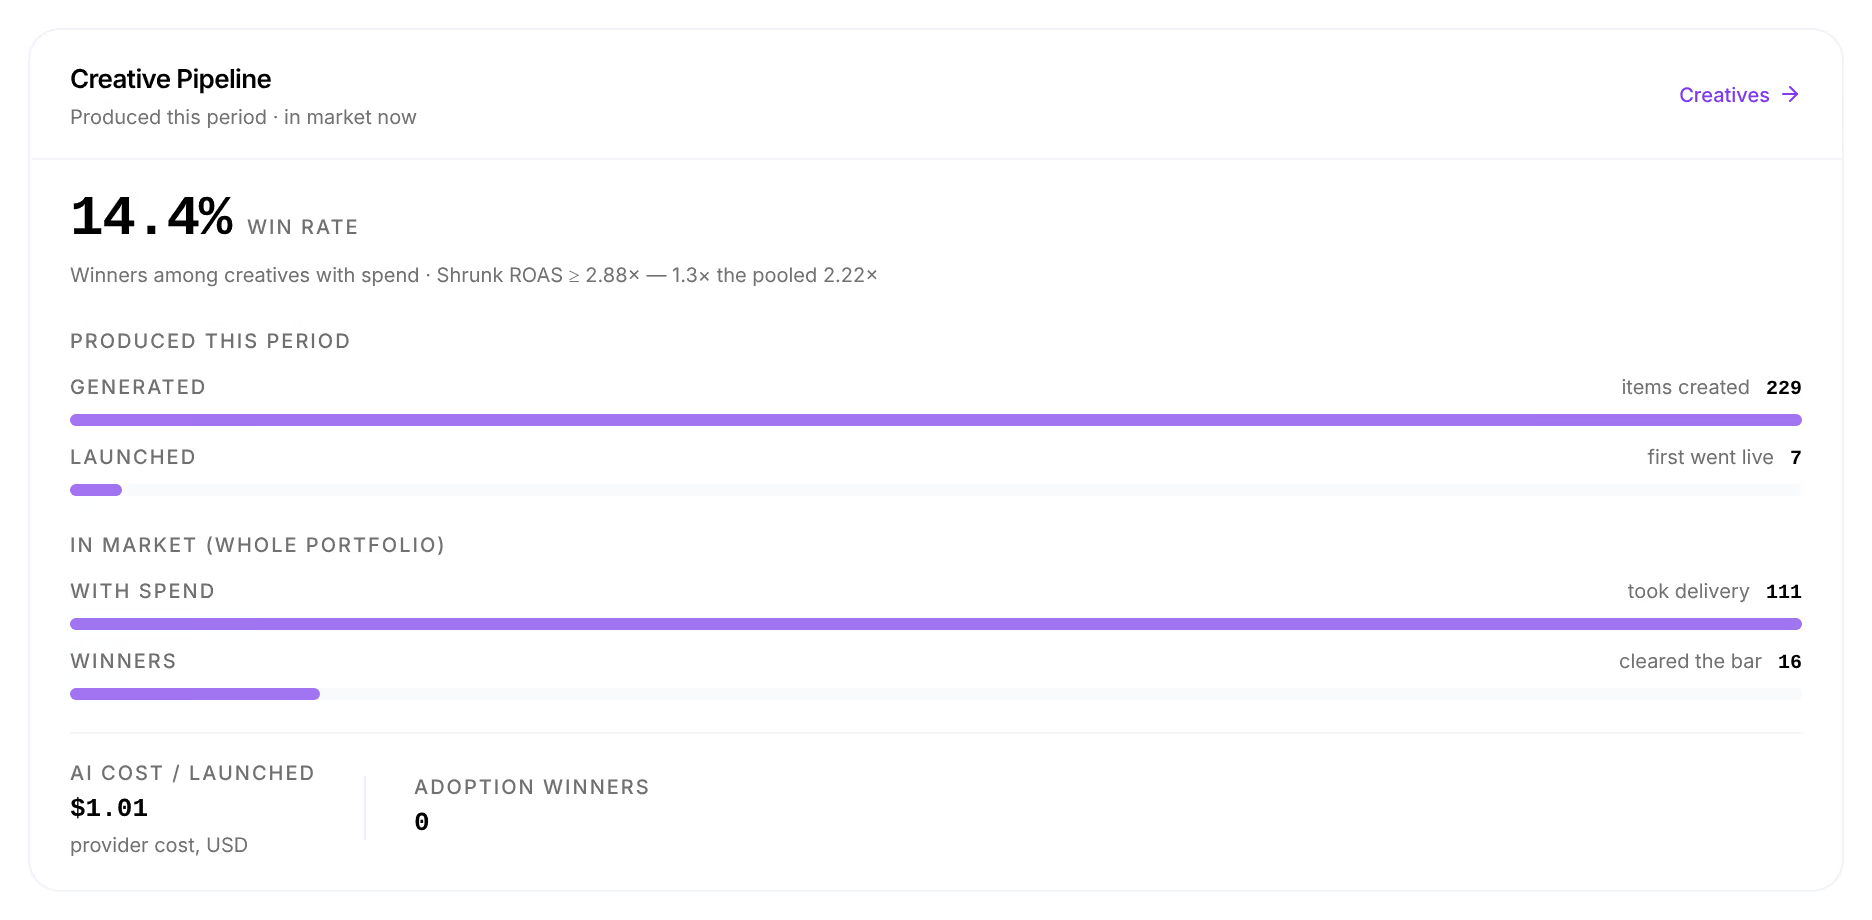
The card answers two different questions, and keeps them apart on purpose: what you made in the period and how much of it went live, and every creative that had spend, whenever it was made.
Produced this period
| Name | What it does |
|---|---|
| Generated | Items created in the last 30 days. |
| Launched | The ones among them that first went live in the period. |
In market (whole portfolio)
| Name | What it does |
|---|---|
| With Spend | Creatives that took delivery in the period, including ones made earlier. |
| Winners | The ones among them that cleared the winner bar. |
The winner bar is printed under the win rate. It reads "Shrunk ROAS ≥" and a figure: by default 1.3 times your store's pooled ROAS, or your own target if you set one. "Shrunk" means a creative's ROAS is pulled toward the store's average until it has enough orders behind it, so one lucky order does not make a winner. A creative also needs a minimum of spend before it can count.
AI cost / launched
What your AI providers charged for generation in the period, divided by the creatives that launched. It is the providers' cost in US dollars, not a charge from Omnymous.
Adoption winners
Creatives that took at least ten times the median creative's spend in the period.
Creatives at the top right of the card opens the Creatives screen.
Recent runs and Top creatives
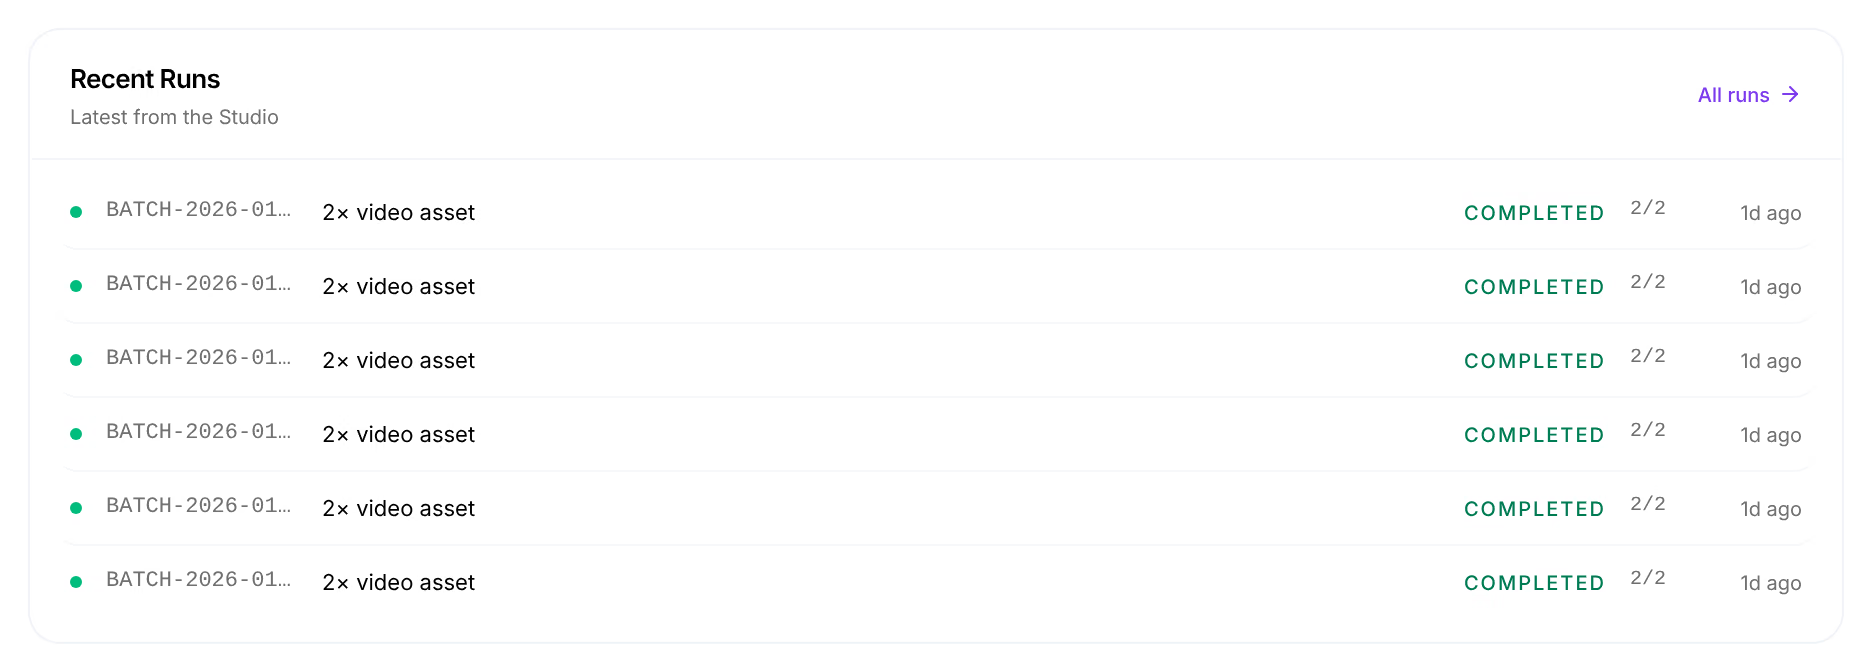
Recent runs lists the latest runs from Studio, with what each made and how it ended. All runs opens Studio's Runs view.
Top creatives lists your highest-spend creatives, ranked by attributed return, with Spend, Revenue and ROAS. Revenue and ROAS here are attributed: credit is split once across the touches in a buyer's journey, so they will not match what Meta reports. Leaderboard opens the full list.
Shortcuts
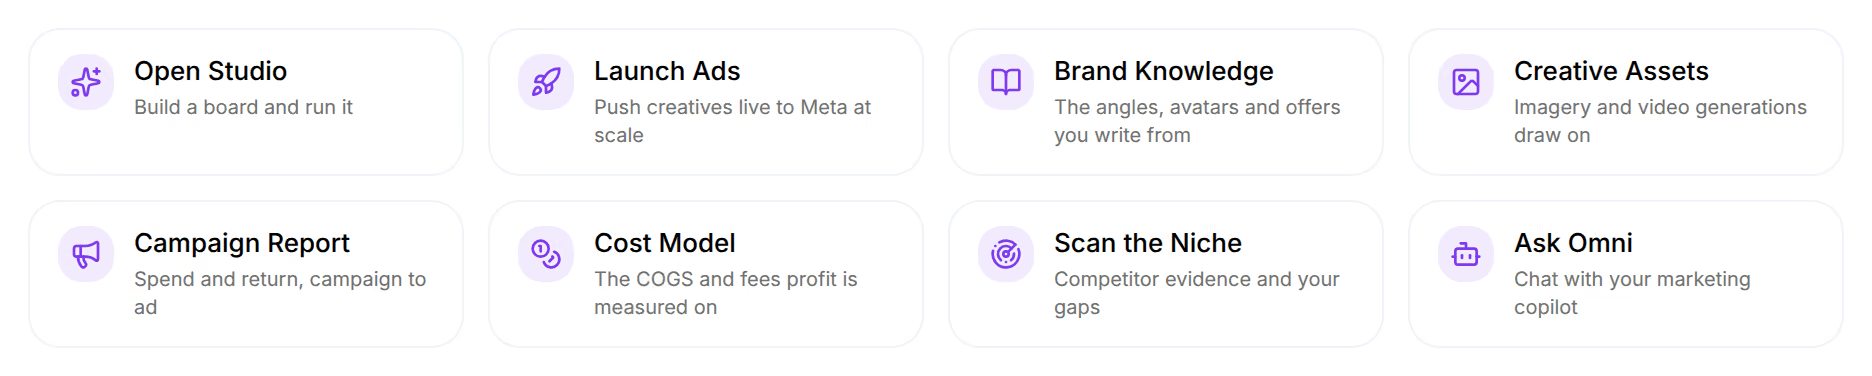
Eight shortcuts to the work you come back to: Open Studio, Launch ads, Brand knowledge, Creative assets, Campaign report, Cost model, Scan the niche and Ask Omni. A shortcut you do not have permission to use is not shown.